Archive
SQL DBA – Query to check Status of last running SQL Jobs
To check the status of current running jobs you can use the “Job Activity Monitor” feature in SSMS, but sometimes opening and refreshing the tool takes time.
Here is a simple query you can run in SSMS or from any custom tool to get the status of current running jobs:
–> Query #1: This query uses sysjobs view to get the list of all jobs and sysjobhistory view to get the latest status record.
SELECT
	j.name AS JobName
	,CONVERT(VARCHAR,DATEADD(S,(run_time/10000)*60*60 /* hours */
          +((run_time - (run_time/10000) * 10000)/100) * 60 /* mins */
          + (run_time - (run_time/100) * 100)  /* secs */
           ,CONVERT(DATETIME,RTRIM(run_date),113)),100) AS RunTimeStamp
	,CASE
		WHEN j.enabled = 1 THEN 'Enabled'
		ELSE 'Disabled'
	END JobStatus
	,CASE
		WHEN jh.run_status = 0 THEN 'Failed'
		WHEN jh.run_status = 1 THEN 'Succeeded'
		WHEN jh.run_status = 2 THEN 'Retry'
		WHEN jh.run_status = 3 THEN 'Cancelled'
		ELSE 'Unknown'
	END JobRunStatus
FROM msdb.dbo.sysjobs j
OUTER APPLY(
	SELECT TOP 1 *
	FROM msdb.dbo.sysjobhistory jh
	WHERE jh.job_id = j.job_id AND jh.step_id = 0
	order by jh.instance_id DESC) jh
where j.name like 'ADF%'
ORDER BY j.name, jh.run_date, jh.run_time
–> Query #2; This query uses sysjobs view to get the list of all jobs and sysjobservers view to get the current status of job.
SELECT
	j.name AS JobName
	,IIF(js.last_run_date > 0,
		DATETIMEFROMPARTS(js.last_run_date/10000, js.last_run_date/100%100, js.last_run_date%100,
		js.last_run_time/10000, js.last_run_time/100%100, js.last_run_time%100, 0),
		NULL) AS RunTimeStamp
	,CASE
		WHEN j.enabled = 1 THEN 'Enabled'
		ELSE 'Disabled'
	END JobStatus
	,CASE
		WHEN js.last_run_outcome = 0 THEN 'Failed'
		WHEN js.last_run_outcome = 1 THEN 'Succeeded'
		WHEN js.last_run_outcome = 2 THEN 'Retry'
		WHEN js.last_run_outcome = 3 THEN 'Cancelled'
		ELSE 'Unknown'
	END JobRunStatus
FROM msdb.dbo.sysjobs j
JOIN msdb.dbo.sysjobservers js on js.job_id = j.job_id
where j.name like 'ADF%'
ORDER BY j.name, js.last_run_date, js.last_run_time
And if you noted in both the queries above, I’ve used different way to calculate the RunTimeStamp, first by parsing the rum_time column, second by using DateTimeFromParts() function.
SQL DBA – SQL Agent Job history not showing or vanishing away
This happened when we started working on a new SQL Server instance for our DEV environment. The history of SQL jobs was not getting retained after a day or few runs.
I checked on the SQL Agent Properties and found that there are some config values set which were very low:
jobhistory_max_rows = 10000
jobhistory_max_rows_per_job = 100
So I checked on MSDN and found that the max permissible values and set them to 999999 & 49999 respectively.

–> This can also be changed by below T-SQL Query by using the system SP sp_set_sqlagent_properties:
USE [msdb]
GO

EXEC msdb.dbo.sp_set_sqlagent_properties
	@jobhistory_max_rows=999999,
	@jobhistory_max_rows_per_job=49999
GO
SQL DBA – Stop multiple running SQL Jobs at once
Just like my previous post on Enable/Disable multiple SQL Jobs [link], here I will show how can we stop multiple jobs running by SQL Agent at once.
–> Although you can very well Stop a SQL Job in SSMS by simple right-clicking on it. But if you have multiple SQL Jobs running, to stop each of them will be a cumbersome and time taking task.
I will show how this can be done by a T-SQL query:
USE msdb;
GO

-- Stop Multiple running SQL Jobs at once:
DECLARE @dynSql NVARCHAR(MAX) = ''

SELECT @dynSql += N' msdb.dbo.sp_stop_job @job_name = ''' + j.name + N''''
			+ CHAR(10) + CHAR(13)
FROM msdb.dbo.sysjobs j
JOIN msdb.dbo.sysjobactivity AS ja
ON ja.job_id = j.job_id
WHERE ja.start_execution_date IS NOT NULL
AND ja.stop_execution_date IS NULL
ORDER BY j.name;

PRINT @dynSql;
GO
Simply Copy-Paste the the above Dynamically generated SQL Script and Execute it, it will Stop all Running SQL Jobs at once.
SQL DBA – Quickly Clone a Database in SQL Server (2016 SP1 & 2014 SP2) with DBCC CLONEDATABASE command
Have you ever been in a similar situation where your PROD database size is in GBs or TBs, and for a code-release validation or some performance-fix you need to restore it on an Dev or Test server? You know that taking backup & restore will take lot of time, but you have no other option.
We also face this many a times as our PROD database size ranges from 500 GB to 1-2 TB, and we end up waiting 4-5 hrs in this activity.
There are even third party tools, but they also take good time and have their own pros & cons.
Now SQL Server brings a new feature with SQL Server 2016 SP1 & 2014 SP2, i.e. DBCC CLONEDATABASE, to create a new database clone of an existing database within seconds. The new cloned database created is ReadOnly, with no data, but with Statistics.
With DBCC CLONEDATABASE feature you can generate a clone of a database in order to investigate a performance issue related to a Query or Workload.
Note: As best practice suggested by Microsoft product team this clone Database is not supposed to remain in PROD database, but can be moved to a Dev or Test box for further troubleshooting and diagnostic purposes.
–> Syntax:
DBCC CLONEDATABASE (source_db_name, target_clone_db_name)
[WITH [NO_STATISTICS][,NO_QUERYSTORE]]
–> The above statement creates Clone of the source database in following operations:
1. Validate the source database.
2. Get S lock for the source database.
3. Create snapshot of the source database.
4. Create an empty database by inheriting from “model” database, and using the same file layout as the source but with default file sizes as the “model” database.
5. Get X lock for the clone database.
6. Copies the system metadata from the source to the destination database.
7. Copies all schema for all objects from the source to the destination database.
8. Copies statistics for all indexes from the source to the destination database.
9. Release all DB locks.
–> Now let’s create a Clone Database on AdvantureWorks database:
-- With Stats

DBCC CLONEDATABASE ('AdventureWorks2014', 'AdventureWorks2014_CloneDB')
Message:
Database cloning for ‘AdventureWorks2014’ has started with target as ‘AdventureWorks2014_CloneDB’.
Database cloning for ‘AdventureWorks2014’ has finished. Cloned database is ‘AdventureWorks2014_CloneDB’.
Database ‘AdventureWorks2014_CloneDB’ is a cloned database. A cloned database should be used for diagnostic purposes only and is not supported for use in a production environment.
DBCC execution completed. If DBCC printed error messages, contact your system administrator.
–> I’ll create one more Clone Database without Stats:
-- Without Stats

DBCC CLONEDATABASE ('AdventureWorks2014', 'AdventureWorks2014_CloneDB_No_Stats')
WITH NO_STATISTICS, NO_QUERYSTORE

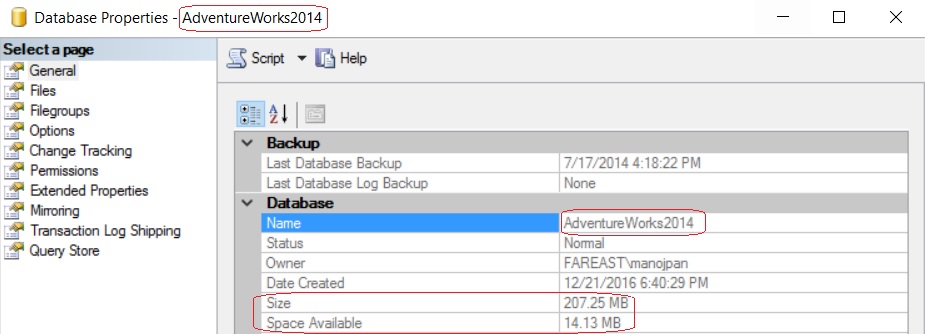
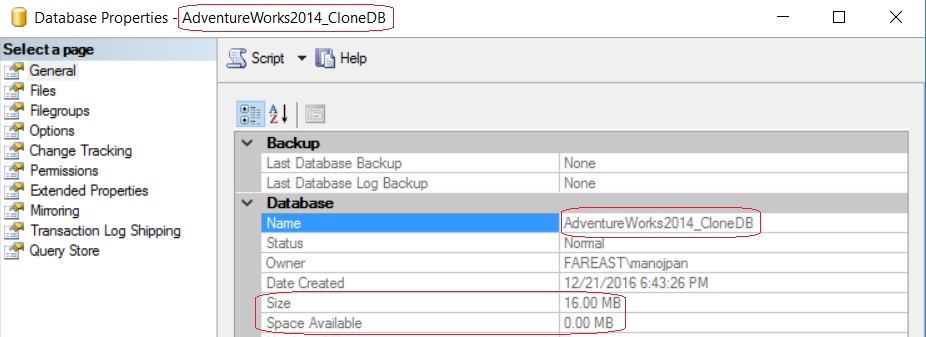
–> Let’s check the file size of all 3 Databases:
– The 1st image shows the size of original AdventureWorks2014 database i.e. 207 MB
– And 2nd and 3rd shows the size of other two Clone Databases i.e. just 16 MB.

–> Now we will check the Execution Plans of a query on all these three databases:
-- Check Execution plan on below T-SQL query in all 3 databases:

SELECT
	P.BusinessEntityID, P.Title, P.FirstName, P.MiddleName, P.LastName,
	E.BirthDate, E.Gender, E.HireDate, E.JobTitle, E.MaritalStatus,
	D.Name
FROM [Person].[Person] P
INNER JOIN [HumanResources].[Employee] E ON E.BusinessEntityID = P.BusinessEntityID
CROSS APPLY (
	SELECT TOP 1 DepartmentID
	FROM [HumanResources].[EmployeeDepartmentHistory] DH
	WHERE DH.BusinessEntityID = E.BusinessEntityID
	ORDER BY StartDate DESC) EDH
INNER JOIN [HumanResources].[Department] D ON D.DepartmentID = EDH.DepartmentID
– On executing the above query on original AdventureWorks2014 database & AdventureWorks2014_CloneDB it shows same execution plan, like it shows:
1. Hash Match operator
2. 72% cost on Person PK
3. 18% cost on EmployeeDepartmentHistory PK

(click on the image to expand)
– But on executing the same query on AdventureWorks2014_CloneDB_No_Stats it shows different execution plan, here it shows:
1. Nested Loop operator
2. 92% cost on Person PK
3. 5% cost on EmployeeDepartmentHistory PK

(click on the image to expand)
SQL Error – SQL Server service failed to Start | Windows could not start the SQL Server
Today I was trying to connect to a SQL Server instance of my DEV machine from SSMS, it took bit more time than usual and threw me an error:
Cannot connect to [SQL_Instance_name], A network-related or instance-specific error occurred while establishing a connection to SQL Server. The server was not found or was not accessible. Verify that the instance name is correct and that SQL Server is configured to allow remote connections. (provider: Named Pipes Provider, error: 40 – Could not open a connection to SQL Server) (Microsoft SQL Server, Error: 2)
I immediately checked SQL Services, and yes the SQL Server service was not running. But when I tried to run the service it didn’t turn up and it gave me an error:
Windows could not start the SQL Server (MSSQLSERVER) on Local Computer. For more information, review the System Event Log. If this is a non-Microsoft service, contact the service vendor, and refer to service-specific error code 14.

Now, the only thing to know what would have happened is the Event viewer.
–> You can open “Event Viewer” by any of the below options:
1. Shortcut: Eventvwr.msc
2. Type “Event Viewer” in search box on Windows 8 and above.
3. Open Control Panel –> System and Maintenance –> Administrative Tools –> Event Viewer
Now on the “Event Viewer” window go to: Windows Logs –> Application
Check the logs on the General or Details tab:

I checked all errors and it threw following errors in sequence:
Error: 49910, Severity: 10, State: 1. (Params:). The error is printed in terse mode because there was error during formatting. Tracing, ETW, notifications etc are skipped.
Error: 17312, Severity: 16, State: 1. (Params:). The error is printed in terse mode because there was error during formatting. Tracing, ETW, notifications etc are skipped.
Error: 17300, Severity: 16, State: 1. (Params:). The error is printed in terse mode because there was error during formatting. Tracing, ETW, notifications etc are skipped.
Error: 33086, Severity: 10, State: 1. (Params:). The error is printed in terse mode because there was error during formatting. Tracing, ETW, notifications etc are skipped.

Error: 701, Severity: 17, State: 65. There is insufficient system memory in resource pool ‘internal’ to run this query.
–> So, if you query these errors in sys.messages then you will see that one of the error (id = 17300) is related to insufficient memory:
select *
from sys.messages
where language_id = 1033
and message_id IN (49910,17312, 17300, 33086)
SQL Server was unable to run a new system task, either because there is insufficient memory or the number of configured sessions exceeds the maximum allowed in the server. Verify that the server has adequate memory. Use sp_configure with option ‘user connections’ to check the maximum number of user connections allowed. Use sys.dm_exec_sessions to check the current number of sessions, including user processes.
–> Let’s also check SQL Server ERROR LOGS, go to Error Log location on you SQL Server machine: C:\Program Files\Microsoft SQL Server \MSSQL11.MSSQLSERVER \MSSQL\Log
I’ve removed unnecessary part here as the error log was too long, highlighted the real cause of the issue, and that is: Failed allocate pages: FAIL_PAGE_ALLOCATION 1.
…
2016-12-15 09:34:14.82 Server SQL Server detected 2 sockets with 10 cores per socket and 10 logical processors per socket, 20 total logical processors; using 20 logical processors based on SQL Server licensing. This is an informational message; no user action is required.
2016-12-15 09:34:14.82 Server SQL Server is starting at normal priority base (=7). This is an informational message only. No user action is required.
2016-12-15 09:34:14.82 Server Detected 143359 MB of RAM. This is an informational message; no user action is required.
…
2016-12-15 09:34:15.27 Server Using dynamic lock allocation. Initial allocation of 2500 Lock blocks and 5000 Lock Owner blocks per node. This is an informational message only. No user action is required.
2016-12-15 09:34:15.27 Server Lock partitioning is enabled. This is an informational message only. No user action is required.
2016-12-15 09:34:20.30 Server Failed allocate pages: FAIL_PAGE_ALLOCATION 1
2016-12-15 09:31:14.07 Server
Process/System Counts Value
—————————————- ———-
Available Physical Memory 145982603264
Available Virtual Memory 140678812086272
Available Paging File 167077097472
Working Set 337784832
Percent of Committed Memory in WS 100
Page Faults 94990
System physical memory high 1
System physical memory low 0
Process physical memory low 1
Process virtual memory low 0
2016-12-15 09:31:14.07 Server Error: 49910, Severity: 10, State: 1. (Params:). The error is printed in terse mode because there was error during formatting. Tracing, ETW, notifications etc are skipped.
…
2016-12-15 09:31:14.08 Server
MEMORYCLERK_SQLGENERAL (node 0) KB
—————————————- ———-
VM Reserved 0
VM Committed 0
Locked Pages Allocated 0
SM Reserved 0
SM Committed 0
Pages Allocated 1240
2016-12-15 09:31:14.08 Server Error: 17312, Severity: 16, State: 1. (Params:). The error is printed in terse mode because there was error during formatting. Tracing, ETW, notifications etc are skipped.
2016-12-15 09:31:14.08 Server SQL Server shutdown has been initiated
…
2016-12-15 09:31:14.08 Server
MEMORYCLERK_SQLCONNECTIONPOOL (node 0) KB
—————————————- ———-
VM Reserved 0
VM Committed 0
Locked Pages Allocated 0
SM Reserved 0
SM Committed 0
Pages Allocated 48
2016-12-15 09:31:14.08 Server Error: 17300, Severity: 16, State: 1. (Params:). The error is printed in terse mode because there was error during formatting. Tracing, ETW, notifications etc are skipped.
…
2016-12-15 09:31:14.08 Server
MEMORYCLERK_SNI (node 0) KB
—————————————- ———-
VM Reserved 0
VM Committed 0
Locked Pages Allocated 0
SM Reserved 0
SM Committed 0
Pages Allocated 16
2016-12-15 09:31:14.08 Server Error: 17300, Severity: 16, State: 1. (Params:). The error is printed in terse mode because there was error during formatting. Tracing, ETW, notifications etc are skipped.
…
MEMORYCLERK_SQLXP (node 0) KB
—————————————- ———-
VM Reserved 0
VM Committed 0
Locked Pages Allocated 0
SM Reserved 0
SM Committed 0
Pages Allocated 16
2016-12-15 09:31:14.08 Server Error: 17300, Severity: 16, State: 1. (Params:). The error is printed in terse mode because there was error during formatting. Tracing, ETW, notifications etc are skipped.
…
2016-12-15 09:31:14.08 Server
MEMORYCLERK_SOSNODE (Total) KB
—————————————- ———-
VM Reserved 0
VM Committed 0
Locked Pages Allocated 0
SM Reserved 0
SM Committed 0
Pages Allocated 26888
2016-12-15 09:31:14.08 Server Error: 17300, Severity: 16, State: 1. (Params:). The error is printed in terse mode because there was error during formatting. Tracing, ETW, notifications etc are skipped.
2016-12-15 09:31:14.08 Server
MEMORYCLERK_SOSOS (node 0) KB
—————————————- ———-
VM Reserved 0
VM Committed 0
Locked Pages Allocated 0
SM Reserved 0
SM Committed 0
Pages Allocated 192
2016-12-15 09:31:14.08 Server Error: 17312, Severity: 16, State: 1. (Params:). The error is printed in terse mode because there was error during formatting. Tracing, ETW, notifications etc are skipped.
MEMORYCLERK_SOSMEMMANAGER (node 0) KB
—————————————- ———-
VM Reserved 480
VM Committed 336
Locked Pages Allocated 0
SM Reserved 0
SM Committed 0
Pages Allocated 0
2016-12-15 09:31:14.08 Server SQL Server shutdown has been initiated
…
2016-12-15 09:31:14.08 Server
MEMORYCLERK_XE (node 0) KB
—————————————- ———-
VM Reserved 0
VM Committed 0
Locked Pages Allocated 0
SM Reserved 0
SM Committed 0
Pages Allocated 376
2016-12-15 09:31:14.08 Server Error: 33086, Severity: 10, State: 1. (Params:). The error is printed in terse mode because there was error during formatting. Tracing, ETW, notifications etc are skipped.
2016-12-15 09:31:14.08 Server
MEMORYCLERK_SQLLOGPOOL (node 0) KB
—————————————- ———-
VM Reserved 0
VM Committed 0
Locked Pages Allocated 0
SM Reserved 0
SM Committed 0
Pages Allocated 152
2016-12-15 09:31:14.08 Server Error: 17312, Severity: 16, State: 1. (Params:). The error is printed in terse mode because there was error during formatting. Tracing, ETW, notifications etc are skipped.2016-12-15 09:31:14.08 Server SQL Server shutdown has been initiated
2016-12-15 09:31:14.08 spid14s Error: 701, Severity: 17, State: 107.
2016-12-15 09:31:14.08 spid14s There is insufficient system memory in resource pool ‘internal’ to run this query.
In the Error Log above you can also see the Error IDs we saw in Event Log, I’ve highlighted them with the Memory Clerks.
–> Now let’s wee if we can start SQL Server with minimal configuration by applying the Startup Parameter “-f”:
Open SQL Server Configuration Manager (SSCM) –> select “SQL Server Services” –> right click on SQL Server service, and select Properties.

Add “-f” as Startup Parameter, as shown below.

Again go back to the SSCM and Start the SQL Server service, this time it will start as you have set SQL Server to run with minimum configuration, and thus it will run on limited memory.
–> Now I opened the SSMS and connected to the respective instance, under Object Explorer right click on Instance name, and selected Properties. Moved to the Memory page and checked the Maximum server memory (in MB) setting. It was just 128 MB, so I increased it to 110 GB as my server RAM was 140 GB.

–> Again went to the SSCM and removed the Startup Parameter “-f”, and restarted SQL Server services.
Now I was able to login to SQL Server instance without any issues !!!


![]()
Current Visitors

StatCounter …since April 2012

 Leisure blog: Creek & Trails
- NMDC Hyderabad Marathon – My first 42k FM, cramps, training and fuelling
- Singapore (Part 2) – 6 days itinerary, sightseeing & attractions
- Singapore (Part 1) – Tickets, Visa, Hotel, Forex Card/Cash, Metro/Bus cards
- I got full refund of my flight tickets during COVID lockdown (AirIndia via MakeMyTrip)
- YouTube – Your Google Ads account was cancelled due to no spend
- YouTube latest update on its YPP (YouTube Partner Program) which may affect your channel
- Starting your own blog !!!
- How to file ITR (Income Tax Return) online AY 2017-18 (for simple salaried)
- Scam – Become a kin/hier and earn a fortune – via LinkedIn and Email
- Places to visit in and around Vizag (aka Visakhapatnam)
