Archive
Self Service BI by using Power BI – Power Pivot (Part 2)
After a long pause I’m back again to discuss on Power BI.
In my previous Power BI Series first part [link] I discussed about the first component of Power BI, i.e. Power Query and how to use it to discover and gather data.
Power Pivot lets you:
1. Create your own Data Model from various Data Sources, Modeled and Structured to fit your business needs.
2. Refresh from its Original sources as often as you want.
3. Format and filter your Data, create Calculated fields, define Key Performance Indicators (KPIs) to use in PivotTables and create User-Defined hierarchies to use throughout a workbook.
And here in second part I will discuss about few of these features.
–> The benefit of creating Data Model in Power Pivot is that Power Pivot Models run in-memory so that users can analyze 100’s of millions of rows of data with lightning fast performance.
All you need is Microsoft Excel 2013 to create your Data Model. Check this [link] to troubleshoot if you don’t see POWERPIVOT option in Excel ribbon.
–> Creating Data Model:
To create a Data Model you need a Data Source, so we will use SQL Server as a Data Source and I’ve setup AdventureWorksDW2012 Database for our hands-on. Click [here] to download AdventureWorksDW2012 DB from CodePlex.
1. Open Excel, and go to POWERPIVOT tab and click on Manage, this will open a new PowerPivot Manager window.

2. Now on this new window, click on From Database icon and select From SQL Server from the dropdown, this will open a Table Import Wizard Popup window.
3. Provide SQL Server Instance name that you want to connect to. Select AdventureWorksDW2012 Database from the Database name dropdown, and click Next.

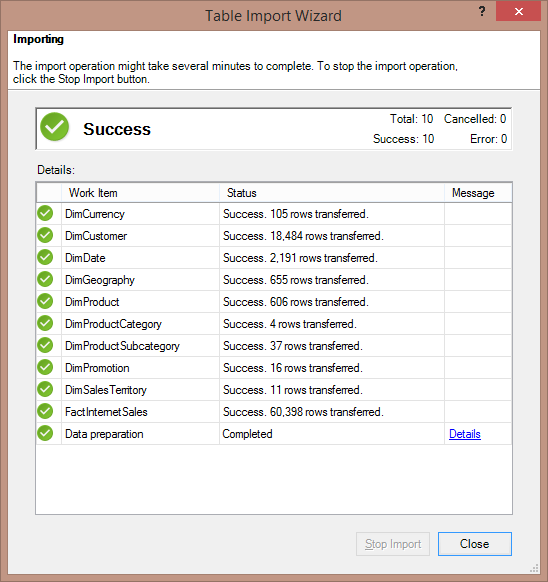
4. Click Next again and select the required Tables (10 selected), click Finish.

5. Make sure you get Success message finally, click Close.
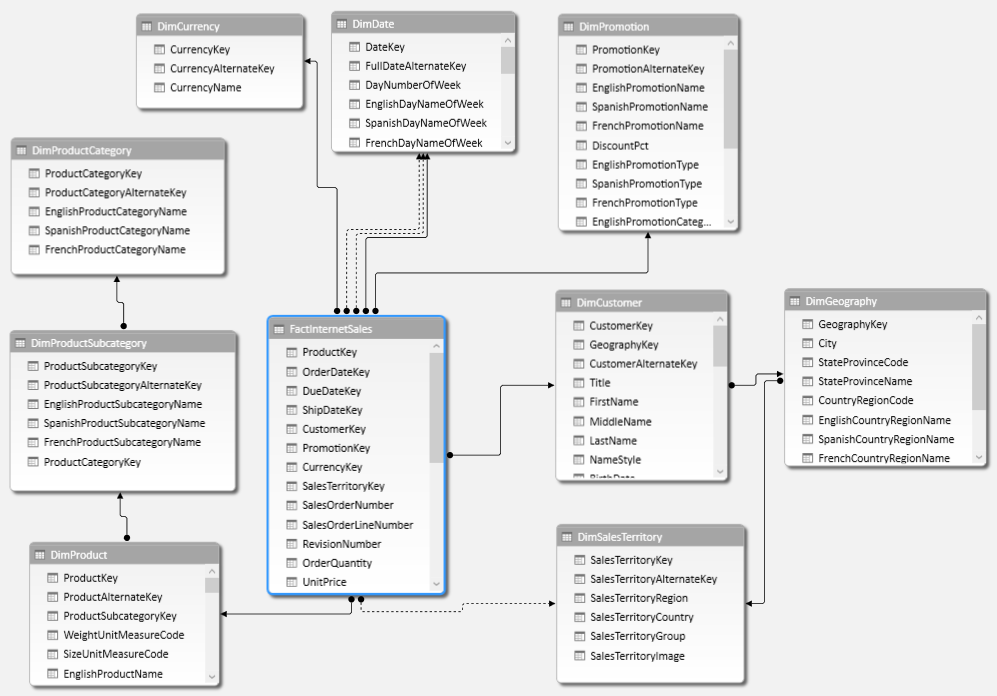
6. In the PowerPivot Manager window you will see many tabs listing records. Click on Diagram View to see all the tabs as tables and relations between them. This is your Power Pivot – Data Model:
–> Now as your Data Model is ready, you can create Pivot Reports in Excel, let’s see how:
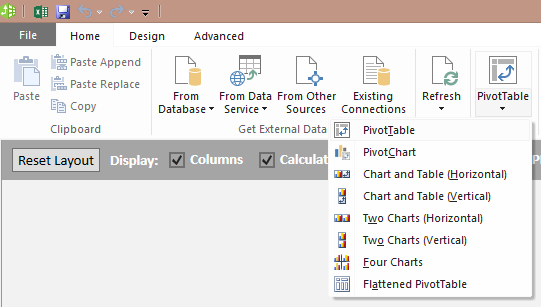
1. Go to the PowerPivot Manager window and click on PivotTable icon and then select PivotTable from the dropdown.
2. The control moves to the Excel sheet, select Existing Worksheet on the Popup.
3. Now select following columns form the PivotTable Fields list:
– DimGeography.EnglighCountryRegionName
– FactInternetSales.SalesAmount
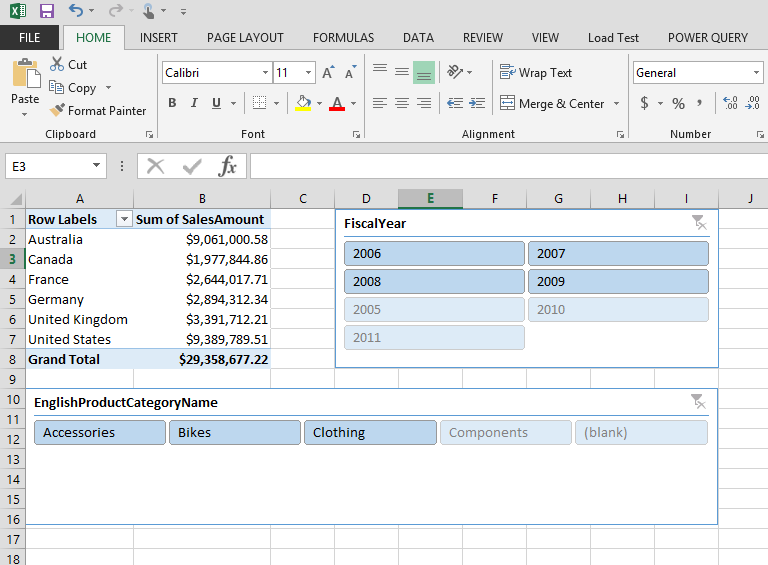
This would give you Total sales across Regions in the Worksheet
4. Let’s add some Slicers to this:
4.a. Click on PIVOTTABLE TOOLS – ANALYZE, here click on Insert Slicer. On ALL tab, select DimDate.FiscalYear column. This will add Year slicer to the report.
4.b. Now again click on the PivotTable Report, you will see the PIVOTTABLE TOOLS on the ribbon bar again. Select Insert Slicer again and select DimProductCategory.EnglighProductCategoryName column.
You can align, move, resize the report, slicers and beautify the report as you want, as shown below:
This way you can add Graphs, Charts and create very impressive Reports UI as per your requirements.
This Power Pivot – Data Model can also be used to create Power View Reports, which we will cover in next part of this series.
Thanks!!!
Self Service BI by using Power BI – Power Query (Part 1)
In my previous posts I discussed about Power BI [link], what is it, its components, features and capabilities in the new world of Self Service IB.
Self Service BI allows end users to design & deploy their own reports, analyse within an approved & supported architecture and tools portfolios. End users do not have to worry about maintaining databases, doing integrations, creating warehouses/marts, reports, etc. The Self Service BI tool provide features which are capable enough to do all these activities in an automated, quick and efficient way, and all you have to do is learn how to configure these tools.
Power BI is one such tool offered by Microsoft, you can read about it my previous posts, [link] and Microsoft Official blog, [link].
Power BI works ONLY with Excel & Office 365. It is nothing but a collection of different components which provide features as follows:
1. Power Query
2. Power Pivot
3. Power View (aka Crescent)
4. Power Map (aka GeoFlow)
5. Power Q & A (aka Natural Language Processing)
6. Office 365
7. Windows 8 App
–> Power Query is used to easily discover or gather data from various public or corporate sources, like:
| Web page | SQL Server database | IBM DB2 database | Windows Azure Marketplace |
| Excel or CSV file | Windows Azure SQL Database | MySQL database | Active Directory |
| XML file | HDInsight | SharePoint List | |
| Text file | Access database | OData feed | SAP BusinessObjects BI Universe |
| Folder | Oracle database | Hadoop Distributed File System (HDFS) |
–> Let’s see a small demo how you can use Power Query: All you need is Excel and Power Query add-In, which you can download from Microsoft official site, [link].
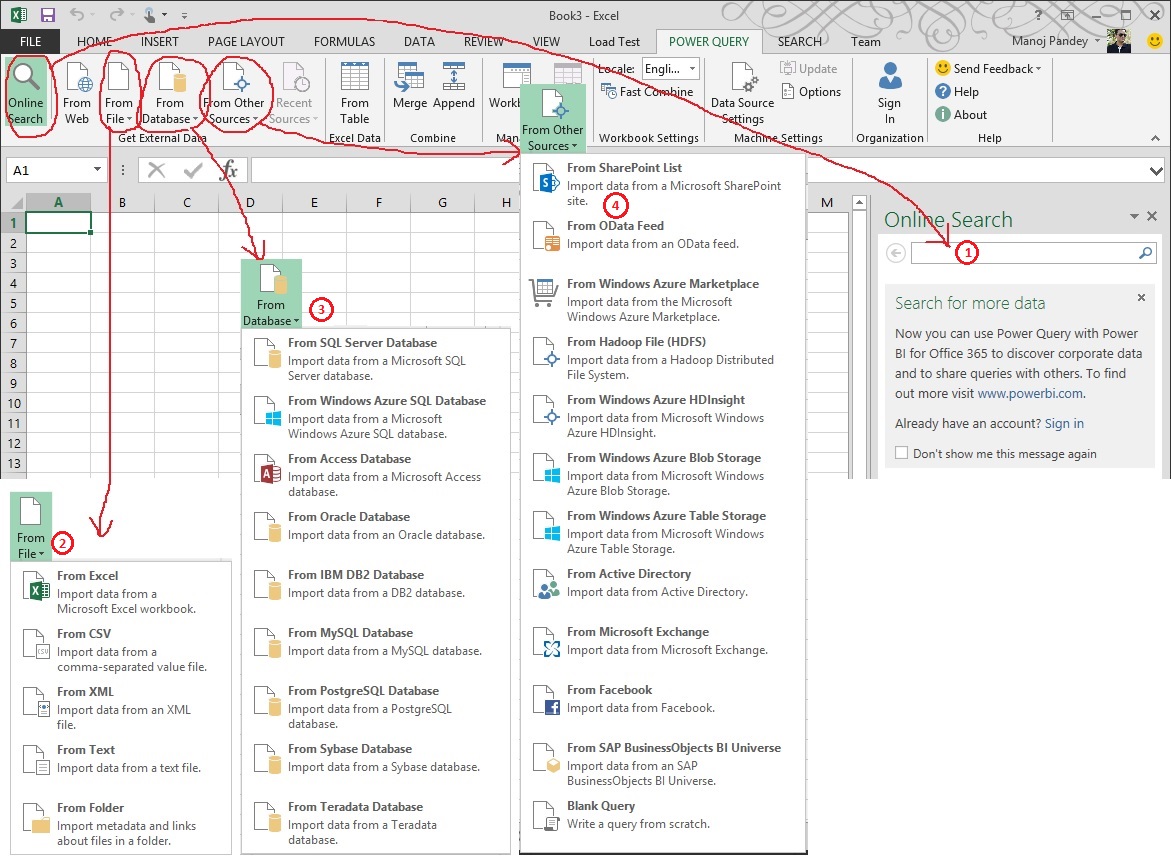
Below image shows various ways you can access public or corporate data from various sources from an Excel workbook:
1. Online Search
2. From File
3. From Database
4. From Other Sources
Let’s see how Online Search works. The moment you type “Olympics 2014” it populates lot of sources from where you can fetch data from:

On selecting a source it tries to connect to the public portal and displays the Source URL while fetching the data:
And finally populates the data in tabular format in an Excel worksheet:
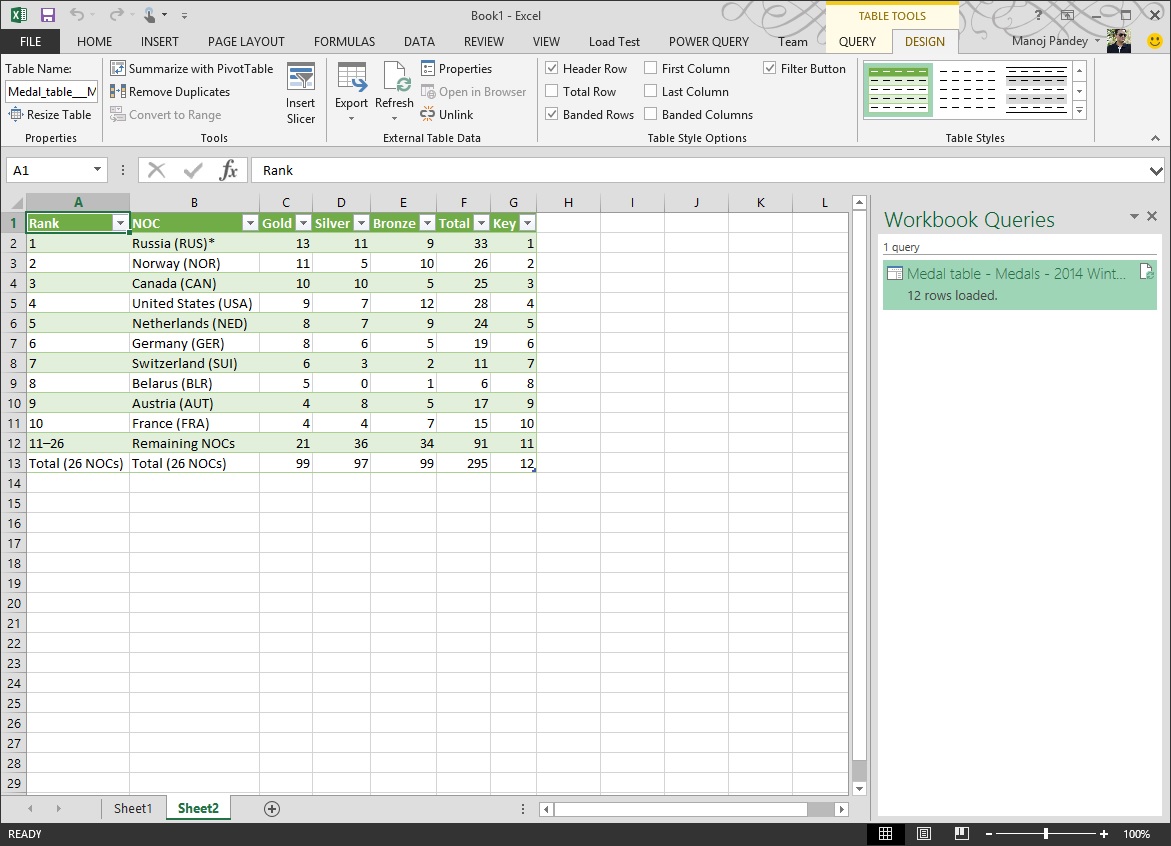
Go to Ribbon, click “Table Tools” -> Query -> Edit, this will open the “Query Editor” window where you can edit, clean the data. You can even Create Queries that you can save and use again later to refresh your data. Merge different tables in one step; rename, delete or even create fields. Transform your data before even importing it into a spreadsheet.

This way you can get your data ‘analysis ready’ with Power Query !!!
PowerBI now GA | Intro & Resources
Power BI for Office 365 is now Generally Available, which is a cloud-based Business Intelligence service that gives people a powerful new way to work with data in the tools they use every day, Excel and Office 365. You can experience both Self-Service BI and Online Services by using Excel and Power BI for Office 365. Power BI delivers a new way to Integrate, Transform and Exploit data through Excel as well as new opportunities to access, Share and Search through Office 365. Power BI is a solution of a Workstation with Excel part and “App”, as well as an Online game with Office 365.
Power BI for Office 365 Overview
In my [previous] blog post I demonstrated the capabilities of Power BI Components by showing their Videos. Here in this post I’ll provide the Resources to setup Power BI environment for you.
>> To start you can Sign up for a Free Trial of Power BI for Office 365 on this site: http://www.microsoft.com/en-us/powerbi/default.aspx#fbid=v0V8xzuZXJR
>> Download components of Power BI integrated into Excel:
1. Power Query
2. Power Pivot
3. Power View
4. Power Map (formerly Geoflow )
5. Power BI Mobile App (or Mobile BI).
>> Online Components in Office 365:
7. Power Q&A
8. Data Management and Data Stewardship
As part of the Power BI trial you’ll also receive a free 30 day trial of Office 365 ProPlus giving you access to the latest version of Excel. Once you have Excel installed, download and install the Power Query and Power Map add-ins for Excel and learn about the new features with the getting started guide.
>> Power BI Offering Options:
1. Power BI, Add-on for E3/E4 Subscribers
2. Power BI, Standalone
3. Power BI, Standalone + Office 365 ProPlus
Check following link for “Power BI” current pricing: http://www.microsoft.com/en-us/powerBI/pricing.aspx?WT.mc_id=blog_PBI_GA_PBI#fbid=v0V8xzuZXJR
Power BI for Office 365 | Self Service BI in Excel
Microsoft Power BI for Office 365 is a collection of features and services that enable you to Visualize data, share Discoveries, and Collaborate in intuitive new ways. Microsoft Power BI for Office 365 provides an Organization-wide Self-service Business Intelligence (BI) infrastructure, and brings Excel workbook sharing, Online collaboration, and IT infrastructure together into a holistic offering.
Power BI consists of many features and services, and works seamlessly with Excel. Use Excel to create compelling content, data models, and visualizations, and then use Power BI to share, collaborate, and extend those insights
>> Self-Service BI Features in Excel: these features extend the data-specific features and capabilities of Excel 2013:
1. Power Query – Discover: easily discover and connect to data from public and corporate data sources
2. Power Pivot – Analyze: create a sophisticated Data Model directly in Excel
3. Power View – Visualize: create reports and analytical views with interactive data visualizations
4. Power Map – Visualize: explore and navigate geospatial data on a 3D map experience in Excel
>> Power BI for Office 365: these features amplify the self-service BI capabilities created in Excel by making them available in a collaborative online environment:
5. Power BI Sites – Share Data & Insights: Share, View, and Interact with reports in these collaborative Power BI sites
6. Power BI Q&A – Get Answers: use natural language queries to find, explore, and report over your data
7. Query and Data Management – share and manage queries and data sources, and view query usage analytics
8. Power BI Windows Store App – Access Data Anywhere: view reports on the go, with the Power BI app
>> IT Infrastructure Services for Power BI: these features get Power BI running in your organization, and enable IT professionals to provide, manage, and secure Power BI services:
9. Provision Power BI for Office 365 – create a tenant, and get Power BI for your organization
10. Power BI Admin Center – manage your organization’s Power BI infrastructure from a site
11. Data Management Gateway – connect on-premises data to the cloud, seamlessly and securely
Power BI Provisioning Guide: http://go.microsoft.com/fwlink/?LinkID=317870
Power BI Getting Started Guide: http://office.microsoft.com/en-001/office365-sharepoint-online-enterprise-help/redir/HA104103589.aspx?CTT=5&origin=HA104103581
Power BI MSDN Blog: http://blogs.msdn.com/b/powerbi/


![]()
Current Visitors

StatCounter …since April 2012

 Leisure blog: Creek & Trails
- NMDC Hyderabad Marathon – My first 42k FM, cramps, training and fuelling
- Singapore (Part 2) – 6 days itinerary, sightseeing & attractions
- Singapore (Part 1) – Tickets, Visa, Hotel, Forex Card/Cash, Metro/Bus cards
- I got full refund of my flight tickets during COVID lockdown (AirIndia via MakeMyTrip)
- YouTube – Your Google Ads account was cancelled due to no spend
- YouTube latest update on its YPP (YouTube Partner Program) which may affect your channel
- Starting your own blog !!!
- How to file ITR (Income Tax Return) online AY 2017-18 (for simple salaried)
- Scam – Become a kin/hier and earn a fortune – via LinkedIn and Email
- Places to visit in and around Vizag (aka Visakhapatnam)
